Copied from thermodynamicsociety.substack.com
Causes and Effects of Climate Change
Choosing the parameters
As part of the planetary and terrestrial fauna, we as humans are completely insensitive to the atmospheric CO2 levels currently negligible to our wellbeing, which are, at the moment, being kept far below even the normal level in our own lungs by the constant effort of floral photosynthesis - to which these levels, especially if terrestrial, are crucial; so while the terrestrial fauna is insensitive to atmospheric CO2 levels as low as today, the flora most certainly is not.
This differential sensitivity is reversed once atmospheric CO2 levels reach 2000 ppm (or 0.2%) and above, or about ten times the current level; at which point it begins to displace the atmospheric oxygen vital to terrestrial fauna; and these levels were reached in the distant past (it should be stressed that, though terrestrial and marine environments and life ultimately share the same carbon and oxygen pool, the waters of this planet hold their own specific reservoirs).
However, the surrounding temperature - which by the way did not reach levels ten times the current value, even under much higher atmospheric carbon dioxide levels - directly affects our comfort, as we can feel it; and more importantly, water-borne, protein-based life on Earth has a viability window of only about 0 - 100°C (higher life form has even less than half that range, topping at around 42°C).
So, despite these scenarios not having come into effect yet, with or without human interference, worries are that this planet could develop a positive feed back loop or "runaway" icebox, or a similar greenhouse effect, which would drive its surface temperature irretrievably out of the viability window in the one or the other direction; especially in the direction of heat, as it is possible to heat, but impossible to overall cool the environment in order to counteract.
Within that viability range, especially terrestrial plants both need and survive higher CO2 levels and higher temperatures to thrive (up to 55°C, with their general optimum interestingly being at just around 42°C as well), than terrestrial animals in general (which in turn must feed on them, as animal life is dependent on plant life) for one - and the current peak values in particular; so one could say that, even at this time, the system in general is slightly tilted in disfavor of the flora and in favor of the fauna - which includes humans.
This may be significant. The common range, in which both terrestrial plants and higher animals can comfortably survive long term, stretches from about 0°C (lower limit for flora) up to 42°C (upper limit for fauna) for environmental temperature and from about 2000 ppm (upper limit for fauna) down to - surprise! 180 ppm (lower limit for flora) for atmospheric CO2 levels. That could be significant as well.
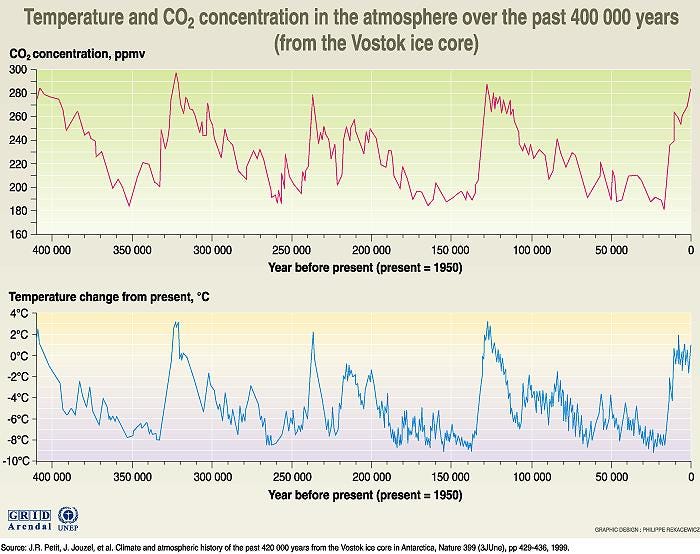
Evaluating the Vostok ice core data curves
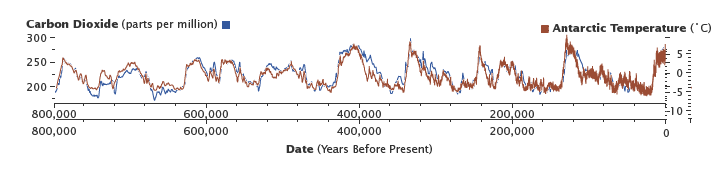
The publicly available graphs of the Vostok ice core data show that, for the past 800,000 years, there has been a sequence of climate changes on this planet from ice ages to warm periods, each natural cycle lasting very roughly around 100,000 years.
A look at the last 800,000 years
For the past 0.8 million years, but not for much beyond that time frame, the Vostok ice core graphs, here for the last 800,000 years,
and here for the last 400,000 years
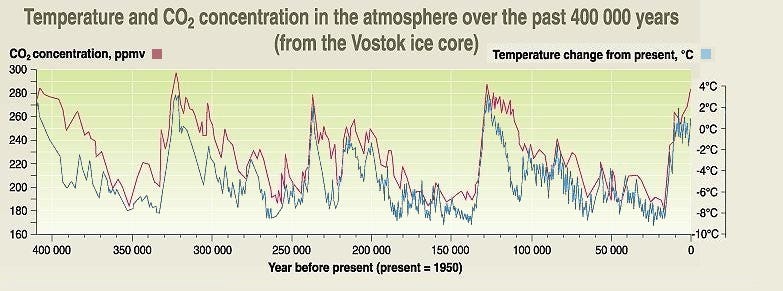
to the present,
-
show a tight relationship between polar air temperatures, polar atmospheric carbon dioxide levels, and, not to be overlooked, the passage of time;
-
but cause and effect are in dispute, and inertia in both directions has to be considered;
-
while a rise in relative polar temperature indeed seems to follow a rise in atmospheric CO2 levels,
-
the subsequent fall in relative polar temperature seems to precede a fall in atmospheric CO2 levels, at least for the last half million years or four glacial / interglacial periods;
-
however, this could be an artifact, which might be alleviated; for instance by raising the baseline of the temperature graph.
[Please note that the color coding for CO2 concentration and temperature are reversed in the original graphs]
Positive and negative feedback between the carbon dioxide level of an atmosphere, and its temperature, with other agents, forms a high probability as well; and just to mention it, levels of another carbon gas, methane (CH4), are equally closely correlated to polar temperatures, some say even more so.
In fact, this graph from euanmearns.com shows that, in contrast to CO2, atmospheric CH4 levels have not risen the last 10,000 years, but have followed the temperature closely, which could mean literally: its release follows the temperature.
This could be significant, too, depending on how methane (CH4) is released into the atmosphere biologically but is degraded chemically; while carbon dioxide (CO2) may be released chemically by oxidation such as fire, but is depleted biologically - at least to a greater part. These differences need to be investigated.
Theoretically, one or more of all three factors - polar temperatures, polar atmospheric carbon, and time could be a cause; and each (except time) could also be an effect:
-
taking CO2 as a widely used representative for atmospheric carbon, the natural and periodic fluctuation over the last 800,000 years of polar atmospheric temperature and carbon dioxide levels could imply that neither CO2 levels nor temperature are the driver, but that time is, with the solar / planetary system running through a combination of complex periodic astronomic constellations;
-
in which case there would be very little, if nothing, that could be done about it, since any change in human behavior would be without effect be on the extraterrestrial cause for natural climate change.
The wider scope: 5 - 500 million years
However, looking at the 5 million year resolution, these fluctuations and their results are not as regular or constant as one might expect under such a premise, assuming all cosmic cycles are known:
-
after having fallen by about 6°C during that time frame, this planet's overall average mean temperature and corresponding CO2 levels seem to have remained relatively consistent for the last 0.8 million years;
-
while their short-term fluctuations, becoming more pronounced and regular over time, about 1.2 million years ago quite suddenly changed their frequency from 41,000 to 100,000 year cycles;
-
at which point not only does the former bottom line now form its upper limit, but a new bottom line is also slowly established, between which two the span of polar atmospheric CO2 levels and temperatures has been augmented and limited to a stable maximum of 100 ppm and 10 degrees respectively;
-
strangely enough for almost exactly the 0.8 million year time frame of the Vostok ice cores. Was Antarctica ice free up to then?
When did it all begin?
The steady and constant fluctuation of atmospheric temperature over millennia seems to have begun some 35 million years ago, the underlying trend to lower temperatures some 15 million and the final trend to increase the spread or amplitude of that fluctuation some 7 million.
While the atmospheric carbon correlation is unknown, some of these numbers will turn up again later in a another context; but in the 500 million year time frame all bets are off: by far most of that time, the average global temperature seems to in no way whatsoever correspond with the atmospheric carbon dioxide levels; moreover, it regularly seems to have leveled off at around 25°C, no matter how high that concentration becomes.
Whatever mechanism is driving the recent and ever-increasing natural climate change cycles over the last few million years, that mechanism itself seems to react to (or cause) a change in mean temperature: the more that falls, the more extreme and regular the changes in atmospheric CO2 levels and temperatures become; and so the mechanism in question could be reacting to it's own lowering of the median atmospheric temperature (and with that, CO2 levels) in an overall cooling positive feedback loop.
This development, the fluctuation itself of atmospheric temperatures and carbon dioxide levels between two thresholds, with a steadily widening spread in amplitude and, coincidentally, wavelength, and a coincidentally dropping median, until reaching the present, if most likely temporary final stability, could point more to internally triggered feedback loops, rather than independent, external forces.
In detail, we find that:
-
polar atmospheric CO2 levels and temperatures coincide, fluctuating naturally and periodically between around 180 and 290 ppm absolutely and +3 and -9°C in relation to today, respectively;
-
these fluctuations are regular, but not of equal length; a short and sharp warming period is followed by a protracted cooling period:
-
a sharp rise in both polar temperatures and atmospheric carbon dioxide is terminated after a time period of around 10,000 years,
-
at the level of 290 ppm and +3°C relative to today;
-
at which point they do not rise any further, nor level out, but abruptly flip to a slow decline during the following 90,000 years into the next glacial period;
-
upon reaching the lower level of 180 ppm and -9°C relative to today,
-
at which point they do not drop any further, nor level out, but abruptly flip to the next sharp rise into the next interglacial period that again lasts about 10,000 years,
-
with both CO2 levels and temperatures rising almost ten times faster than they previously dropped;
-
this behavior becomes more marked over time, corresponding with tighter data.
To note, these fluctuations within both atmospheric carbon dioxide and temperature levels of the last 0.8 million years are shown to be far greater than the variation in their minimum and maximum values, giving rise to the thought that, though planetary conditions may run rampant within their natural boundaries, they can not pass certain upper or lower limits under a given situation - and that the correspondence of these with possible other boundaries might not be purely coincidental. There are no...
To take an even closer look at the details, the available Vostok ice core data curves for polar atmospheric temperatures and CO2 levels, which thankfully both correspond in time (if not always in amplitude), were marked with their "peaks" and "troughs" and evaluated, while endeavoring to keep the unavoidable outcome manipulation, in pinpointing these, to a minimum.
The 800,000 year amplitudes
Over the past few million years, the amplitude of natural climate change shows a trend to steadily increase; and though the published graphs for the past 0.8 million are not quite consistent in these values, the average polar atmospheric temperatures and CO2 levels that could be extracted from them are:
Interglacial temperature peaks in °C, relative to today:
-1, -2, -1, -2, +2, +3, +2, +3, +0
Relative temperature peak range: -2°C | + 3°C |, or 5°C of 12°C in total
Interglacial CO2 level peaks in ppm, absolute:
260, 240, 260, 250, 280, 300, 275, 280, 290 [pre-industrial]
Absolute CO2 peak range: 300 ppm | 240 ppm, or 60 ppm of 110 ppm in total
Glacial temperature troughs in °C, relative to today:
-8, -8, -8, -7, -8, -8, -8, -9, -9
Relative temperature trough range: -7°C | -9°C or 2°C of 12° in total
Glacial CO2 level troughs in ppm, absolute:
190, 175, 170, 190, 190, 180, 180, 180, 180
Absolute CO2 trough range: 190 ppm|170 ppm or 20 ppm of 110 ppm in total
If this is the case, then the lower limit for both temperature and CO2 levels (1/6 of total range) is defined more sharply than the upper limit (1/2 of total range), suggesting that if there are terrestrial feedback loops driving the natural regular climate change cycles, the low point trigger would be more sharply defined than the high point trigger; and, while the spread between these points increases over time, the correspondingly sudden flip-flop in both values does suggest such triggers.
The 800,000 year wavelengths
Over the past few million years, but more markedly the last 0.8, the wavelengths of the natural climate change cycles also show a steady trend towards a slow increase.
Beginning 800,000 years ago (and allowing for some interpretation), the time elapsed (in thousand years) is,
- from interglacial peak to interglacial peak:
[offset: 10] 95, 105 (anomalous double peak), 100, 80, 75, 90, 115, 130, [offset: 0]
- and from glacial trough to glacial trough:
[offset: 0] 60, 70, 140 (anomalous double peak), 90, 85, 100, 115, 120, [offset: 20]
- the duration of interglacial peaks (in thousand years) is:
10, 45, 80 (anomalous double peak), 40, 35, 25, 15, 10, 20
- the duration of glacial troughs (in thousand years) is:
0, 50, 25, 60, 50, 50, 75, 100, 110
(Note the last glacial trough is offset to today by 20 thousand years, not 10.)
Evaluation
Combined, the waves of interglacial peaks and glacial troughs have steadily increased both in length and amplitude over the last 0.8 million years with 9 natural climate change cycles; over time, the glacial troughs have grown longer, with somewhat lower temperatures, while the interglacial peaks have become shorter, but hotter.
The glacial bottom line remains relatively constant in both atmospheric CO2 levels and temperature, dropping very slightly, if at all, while both rise as a trend during interglacial peaks; excepting the very recent temperatures, which, compared to recent CO2 levels, are lagging behind.
It would be difficult to discern from this alone, which one of the two values, atmospheric CO2 levels or temperature, would be the primary driving force behind this kind of tripwire behavior, i. e. which would be the one more likely to act as or react to a tripping value, triggering a counteraction;
-
either with different CO2 levels acting as a variable in atmospheric insulation,
-
or variable temperatures raising or lowering the storage or sequestration of carbon in the environment.
The arctic nature of the ice core measurements holds another difficulty: though variable in season, atmospheric carbon dioxide levels will be more or less the same both in the polar and equatorial regions of a planet; but temperatures most certainly are not.
And to assume that equatorial or even mean temperature fluctuations, due to any given cause, will equal the fluctuations in polar temperature, is daring as well, and seems to be refuted for at least the last 250 million years, in which polar temperatures are said to have fallen much further than equatorial ones (to wit: the projected anthropogenic global climate change is calculated very roughly at 1°C increase for every 100 ppm increase in atmospheric CO2 levels; the Antarctic Vostok ice cores, equally roughly, show a 10°C difference for every 100 ppm).
But even if the relative difference in polar temperatures of -9°C | +3°C to today were reflected 1 : 1 in equatorial values, the mean of which currently lies at about 29°C, a global drop in temperature of 9°C would still leave it at a comfortable average of 20°C, with no detriment to plant or animal life; and a rise of 3°C would make it only slightly hotter on average than today, but still not dangerously so, especially not to plants - which, by the way, holds true the other way round: a slight change in equatorial temperatures could be reflected in a large one in the polar regions of this planet.
Comparing the data
A qualitative comparison of this data in two graphs
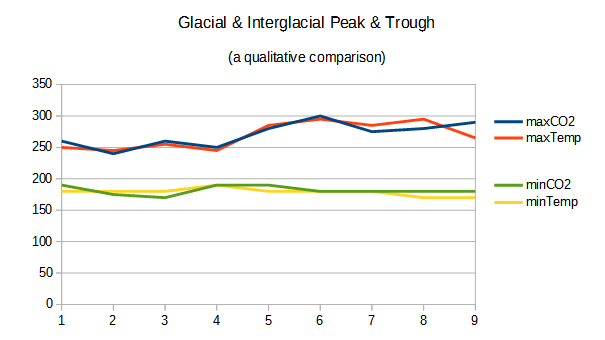
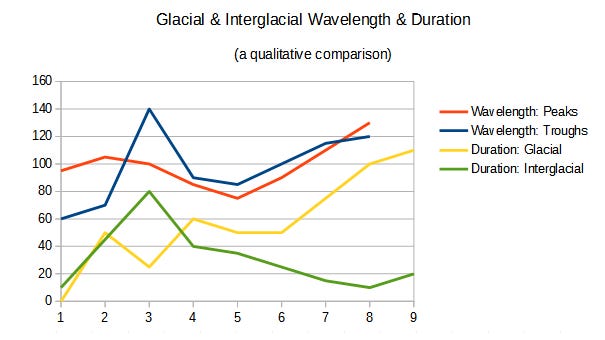
shows that both peak & trough wavelengths (with the exception of the anomaly 600,000 years ago) as well as the duration of the glacial periods have steadily lengthened; while that of the interglacials - like our current period - has shortened.
But, while both maximum and minimum polar temperature and atmospheric CO2 levels correlate quiet well, generally, over the observed stretch of time (though not necessarily before), this last and current period (of 20,000 - not 10,000 years!) breaks the trend in both duration of the glacial and interglacial, as well as the maximum temperature; and especially that last deviation does not seem to be an artifact, as higher resolutions show.
The effect of Photosynthesis on atmospheric CO2 levels
Finding that, according to this graph, atmospheric CO2 levels and the surface temperatures on Earth - the average of the which seems to have quite regularly leveled off at around 25°C absolute, or 10-15°C higher than today (which in itself is quite a lot) regardless of carbon dioxide levels being partially more than tenfold higher than present - correlate only during less than half of the observable time period of 500 million years, but do so very well under recent and current conditions (i. e. with both values historically low), it can be speculated as to why.
There are many possible factors; and it should help to eliminate those that are not recent, and look for those that are.
Caveats
There seems to be open dissent on which regions of the world are (and therefore were) most affected by climate change; and perhaps one should not so much focus on the direct effects of absolute temperatures, which are in dispute, but rather on the amount of heat or energy stored in the environment, which can be indirectly measured by the amount of ice in a region - where there is ice; atmospheric water vapor would be an indicator where there is not. Both would, in either direction, buffer changes in temperature.
Then there are the oceans, absorbing and releasing carbon dioxide, dependent on temperature, and probably a host of other factors. Especially the thawing and freezing in the intermediate zones of this planet will have a direct effect on the amount of plant, and with that, animal life; both of these then have an effect on the amount of climate-affecting gases retained in the atmosphere, such as carbon dioxide (CO2) or methane (CH4).
In other words, global 'warming' or 'cooling' can take place without a rise or fall in temperature, but still affect all living systems; global thawing should not be confused with global warming. That will follow.
Furthermore, twice a year, the hemispheres of this planet alternately experience an externally induced short-term climate change, from winter to summer and back again,
-
in which atmospheric CO2 levels rise with the cold in winter (by about 20 ppm as far as can be discerned) due to the lower temperatures causing the levels of photosynthesis to diminish,
-
and fall in summer due to the higher temperatures enhancing photosynthesis;
-
this is somewhat the opposite of their long-term global behavior,
-
where high levels of atmospheric carbon dioxide actually warm the planet through insulation, and low levels cool it accordingly;
-
so there is something of a cause-and-effect negative feedback loop to look out for here.
The reversion of cause and effect:
-
Thus, an elevated level of atmospheric carbon dioxide raises the surface temperature of the planet, which in turn lowers the level of atmospheric carbon dioxide due to photosynthesis; and vice versa.
-
This effect is induced externally induced by an astronomical constellation.
-
But could it become an internal, independent cause for natural, cyclical climate change on a planetary level?
The possible involvement of life in climate change
Solar radiation may warm a planet directly, and atmospheric carbon dioxide insulate it from the surrounding cold of outer space; but if it has an active flora, its photosynthesis, by reducing the amount of insulating carbon dioxide in the atmosphere, proceeds to cool it again indirectly.
So it could very well be that the interaction of terrestrial life (and, in other ways, marine life as well) with the atmosphere plays a, possibly even decisive, role in flip-flopping the natural climate change cycles of the last 0.8 million years on this planet, and if so, before that as well; as all relevant factors are mutually interdependent.
A few of these are:
-
External forces and global factors: Atmospheric and surface temperatures depend on solar radiation, cosmic constellation, and atmospheric insulation, in which carbon gasses such as carbon dioxide and methane play a part.
-
Absorption: The lower the overall temperature, the more of these carbon gasses are physically absorbed by land and sea; the higher the temperature, the more are (re-) released into the atmosphere.
-
Biological activity: Atmospheric carbon gas levels are dependent on the levels of photosynthesis and decay taking place (usually at the same time).
Photosynthesis, in turn, is dependent on both atmospheric temperatures and CO2 levels, as they are displayed by the Vostok ice cores (as taken from inforse.org):
Lower solar energy input, as an external cause, thus causes lower levels of biological photosynthesis, bringing on higher CO2 levels - and therefore, higher planetary temperatures; thereby enhancing photosynthesis.
This can be offset by higher levels of physical absorption or sequestration (i. e. condensation), which on their own (without regulating flora) could cause a runaway icebox (or, mutatis mutandis, greenhouse) effect.
But with stable or averaged energy input, planetary generated higher carbon dioxide levels bring on higher average temperatures, which in turn cause higher levels of photosynthesis; these, over time, would lower the CO2 levels again, resulting in both lower temperatures and lower photosynthetic activity.
This is in accordance with the Vostok ice core data, and points away from changes in external energy input as a cause for natural climate change.
Also to be noted once again, the CO2 levels represented in the Vostok ice cores constitute an absolute measurement; the temperature measurement is a relative one.
And if the requirement for an internal trigger of a sudden change, in a natural surrounding, is to be sudden and global, it seems safer to consider a factor, that, like atmospheric carbon dioxide levels, tends to be more or less equal all over the world, while temperatures on Earth differ wildly at any given time;
-
as always, even more factors not yet considered could also play a key role, such as the albedo, clouds, other carbon gases, and the smothering of terrestrial life under a sheet of ice;
-
but it could also very well be that all possible factors are bound into one decisive mechanism for a natural, cyclical, regular, planetary climate flip, increasingly expressing itself in shape and impact over the past 0.8, or even 5 million years.
Searching for a possible mechanism for regular climate change
The mechanism to look for, if assuming it to be biological in nature, would have to, over the past 5 million years, and within the given terrestrial and extraterrestrial circumstances,
-
involved the atmospheric carbon dioxide levels and planetary surface temperatures;
-
have kept the global temperature and atmospheric carbon dioxide levels fluctuating between a set of two boundaries,
-
while enhancing their spread and edging closer toward, possibly, some natural limits;
-
flip and flop suddenly upon touching one of these respective boundaries, either towards a sharp rise, or towards a slow decline;
-
and, over time, become more distinct and develop ever greater momentum;
-
either enhanced, or unperturbed by, sinking overall mean temperatures,
-
perhaps even causing them.
Since by far the most of this behavior has occurred over millennia without human interference, especially not through industrialization and the release of fossil carbons, the questions to answer seem to be:
-
What happens naturally at an atmospheric CO2 level of around 180 ppm and in a relatively cold surrounding, i. e. in vast regions of comparatively low temperatures on a partially ice-covered planet?
-
What happens naturally at an atmospheric CO2 level of around 290 ppm and mean temperatures slightly higher than today, in relatively warm surroundings on a planet (mostly) devoid of ice?
Let’s speculate ->
Comments
Post a Comment