Copied from thermodynamicsociety.substack.com
Comparing the Time Frames
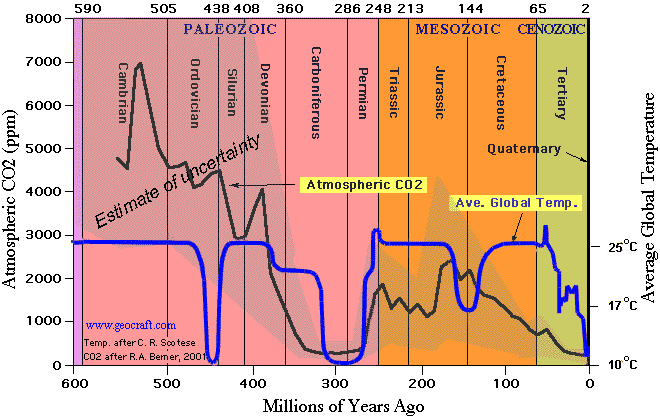
(500 million years of climate change)
Planetary temperature fluctuations:
Internal or external causes?
Lately, the focus in things climate change has shifted from Thunberg (perceived cause: internal forces) back to Milankovic (perceived cause: external forces) and back again within just a few months.
Nevertheless, the fact remains that, though astronomic or cosmic cycles and positions can be predicted with utmost precision, weather and climate on Earth still and most obviously can not; it seems there may be other factors involved; like - well, perhaps, indeed, the makeup of the planet's atmosphere.
So, the following is premised on the assumption that, just as does the Sun's intensity, the position of Earth in Space, and even its own geothermal heat, atmospheric carbon dioxide can and does influence this planet's surface temperature; at least it is doing so under the current circumstances.
If it doesn't, then other explanations will have to be found for the phenomena observed.
If it does, the question is how, and how much; the increase in temperature induced by atmospheric CO2, as given by different authors, lies somewhere in the range of +0°C to +30°C, which almost renders any discussion useless.
The following is therefore hypothetical in its attempt. It presents one possible way of interpreting the depictions of the data as they are found in public.
Interpreting publicly available depictions of scientific data is always difficult and tends to be inaccurate; however, it is these that are driving the discussion, so it might help to take a step back for a closer look at what they actually show.
500 million years of climate change
Comparing the time frames for consistency
The graphs presented here have been chosen from a variety of similar depictions, which seem to have been agreed upon as valid.
They cover three general time frames, around 500 million, 50 million, and 1 million years to the present; the later ones focus on the past 10,000 years. As one can imagine, the smaller time frames show a reasonable margin of error, the larger ones a significant one.
There may be more links to other graphs and external pages throughout this text to illustrate a given point, but they basically do not differ from the ones referenced here.
· The past 500 million year overview (taken from ghornerhb)
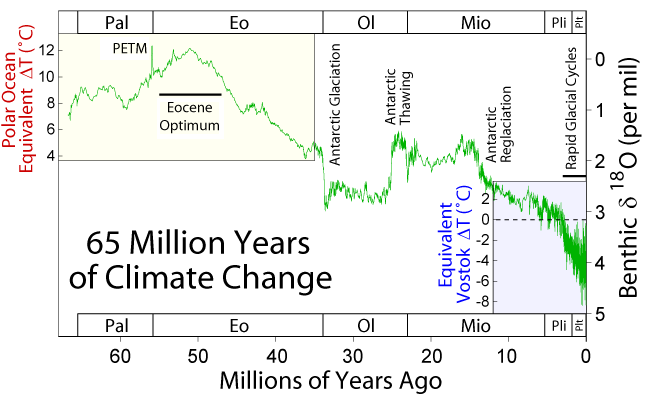
· Therein: The past 65 million year overview (from Wikipedia):
· Therein: The past 5 million year overview (from Wikipedia):
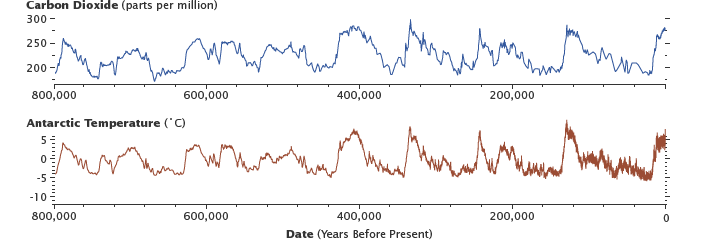
· Therein: The past 0.8 million year overview (Vostok ice core data):
taken from nasa.gov or Wikipedia
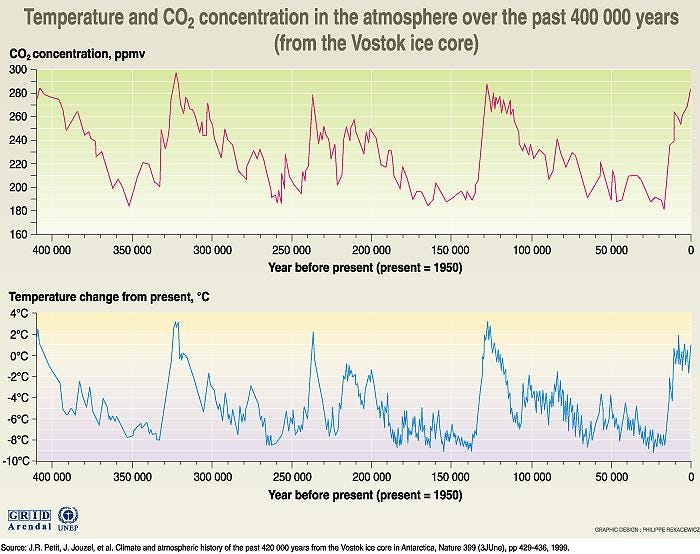
· Therein: The past 0.4 million year overview (Vostok ice core data):
taken from inforse.org
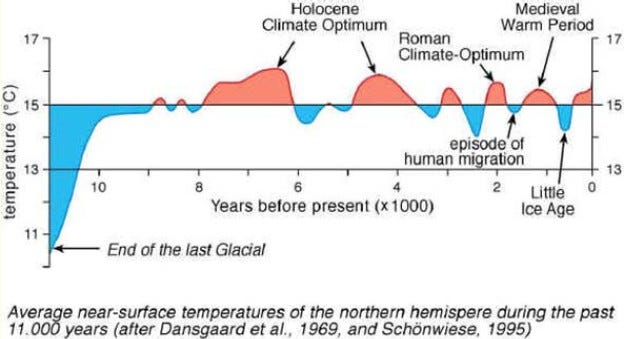
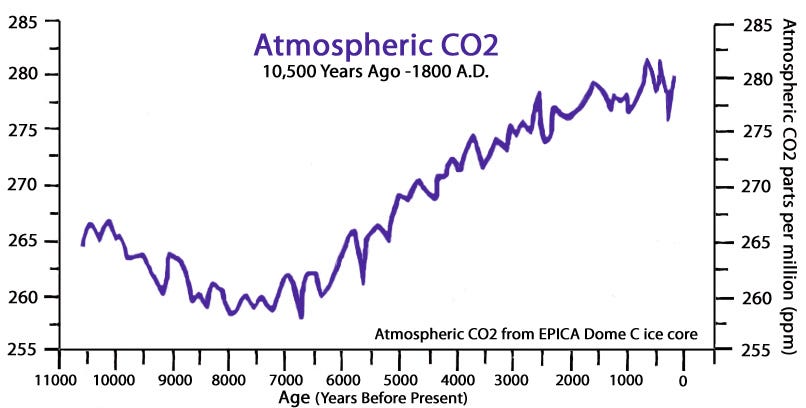
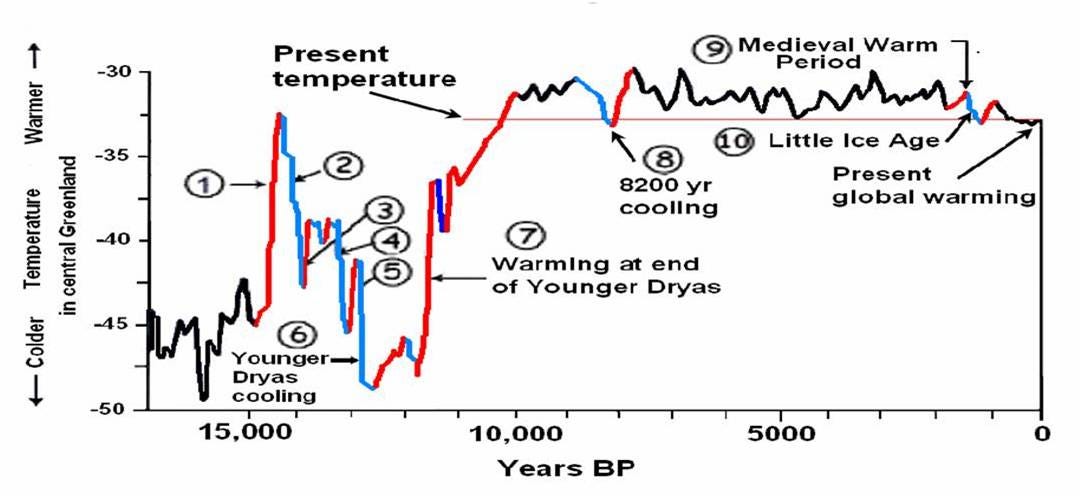
· And for the last 0.01 million or 10,000 years:
taken from schaatshistorie.nl, together with
taken from notrickszone.com
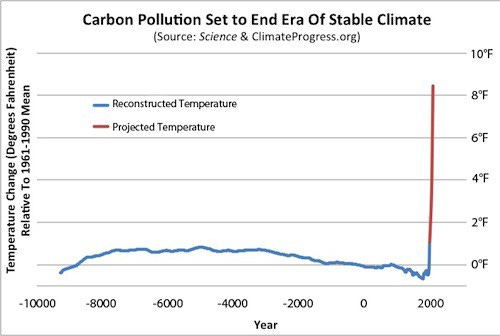
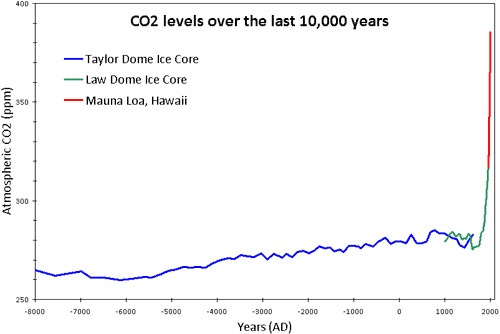
For easier and direct comparison:
Temperature:
- taken from https://thinkprogress.org -
and CO2 levels:
- taken from frankbacker.nl
The last two sets show the same:
While the level of atmospheric CO2 has risen during the last 10,000 years, the mean surface temperature of the Earth has remained stable - perhaps even falling slightly.
Conclusions
The graphic depictions in use here are consistent with one another; the higher resolutions are encapsulated in the lower ones.
So, indeed:
-
We are currently living at the height of an interglacial or warm period
-
which has remained remarkably and unusually stable for 10,000 years,
-
within a million- year- era of cyclical ice ages,
-
which has developed during tens of millions of years,
-
in which the planet cooled to a second minimum within 500 million years,
-
developing, over time, a regular 100,000- year- fluctuation, both
-
in surface temperature, as well as in tightly corresponding levels
-
of atmospheric carbon dioxide (CO2).
On the face of it, this does not seem to be driven by external forces, which would mostly, one could imagine, remain rather more constant over a longer period of time (though the overall regularity of the Sun’s radiation does remain in question); especially the regular, but uneven frequency of (usually) 90 / 10 thousand year glacial / interglacial ratio of succession, combined with their seemingly remarkably constant tipping points of 180 ppm and 290 ppm (assuming that atmospheric carbon dioxide is the driver), could point to a biologically driven, or at least enhanced, mechanism.
Photosynthesis and Climate Change
The following shall be discussed here:
-
There has been a natural climate fluctuation for at least a million years
-
This could, at least in part, be biological by cause
-
Humans have most possibly played a role in the latest stages
There has been much discussion about climate change, and most of it refers in some way or another to the Vostok ice cores and similar evaluations.
Under the premise once again that the data gleaned from these is correct, their interpretation is correct (which is by no means certain, as the controversy of Mann vs. Ball shows), and their publicly available depiction in the graphs referred to below, as well as other public statements, are correct (which is by no means certain either), it would seem to follow that for the last million years, at least, the Earth's climate (rather: it's mean average surface temperature) has not only constantly changed, but that this change has been
-
confined in range and
-
regular in nature.
During this time, the publicly acknowledged culprit behind climate change, the amount of carbon dioxide in the atmosphere of this planet, in equally limited and regular fluctuations,
-
did not register above 290 ppm, its peak value before industrialization,
-
nor did it fall below 180 ppm;
not in the 800,000 years evaluated in total, and not in the supposed 400,000 years - or perhaps only 300,000 years - of the existence of Homo sapiens contained therein.
This differs wildly from the time before; and so other factors come into play as well, which will be touched upon in the following.
Such a fluctuation range of 110 ppm (or 0.011%) in natural polar atmospheric CO2 levels could intuitively be considered as negligible; however, the corresponding polar atmospheric temperature fluctuation range of around 12°C, or between +3 and -9 degrees Celsius of average polar temperature relative to today, seems quite enough to mark the difference between an "ice age" or glacial and a "warm period" or interglacial - which, by the way of speech, also declares the glacial epochs to be the norm; and indeed, under the reigning circumstances, they make up the majority of the time.
This is borne out by the Vostok ice core data as referenced above: during the last 0.8 million years, the top half of the 12°C range contains less than half the data; and it corresponds to a current global mean temperature of around 15°C, which itself is not very much above the freezing point of water - even though the evaluation of the Vostok ice cores show us to be, right now, at or near the end of the current interglacial period; and therefore at or around the epochal peak temperature.
More precisely, in comparison with previous interglacial peaks, previous peak CO2 levels were almost reached, just before the massive utilization of fossil fuels began to artificially enhance them some 200 years ago - but the corresponding natural peak temperatures were not; nor do they show any tendency to that effect.
In fact, for some 10,000 years now, the polar atmospheric temperatures seem to have entered a "stable climate" anomaly, fluctuating tightly around a new stable mean. This coincides with the arrival of modern man.
(taken from perceptionasreality.blogspot.com)
How did this happen? ->

Comments
Post a Comment