Copied from thermodynamicsociety.substack.com
Introduction and historical Abstract
Cause and effect of past and future variations in the levels of carbon dioxide (CO2) in the Earth's atmosphere and its surface temperature
I shall assume, in the following,
-
that the level of atmospheric carbon dioxide (CO2) indeed does have the potential to have a positive effect on the world's average superficial temperature (the so-called greenhouse effect), and
-
that the measurements and resulting assumptions and graphic depictions, shown here, of past levels of atmospheric CO2 and superficial temperatures - within their stated temporal and spatial limitations - are correct, and that
-
any other statements and depictions I call upon as witness are correct as well; and meaningful.
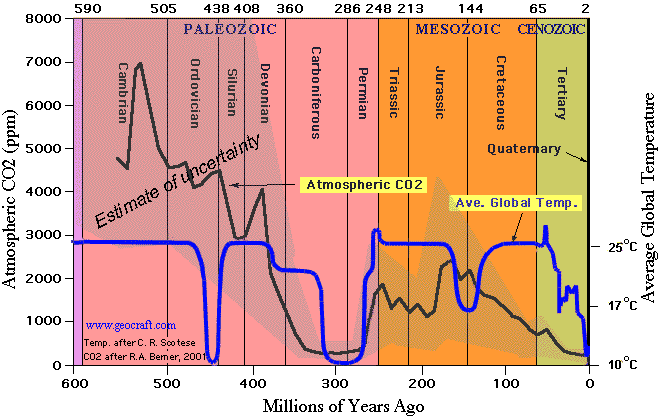
If this is so, then a simple evaluation of the following graphs, for which there are either multiple sources, such as for the following (from here):
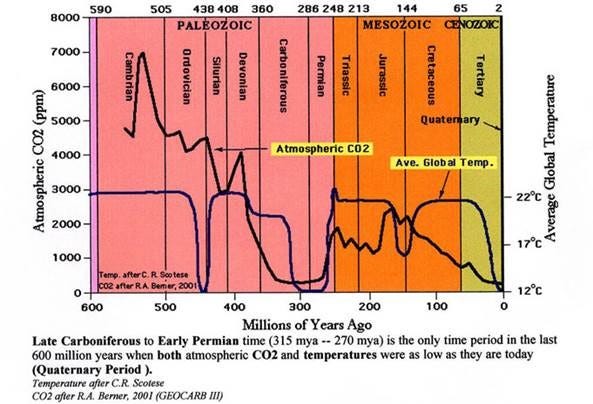
or, from here:
(or which, as later ones, can be found on Wikipedia commons or other sites)
would show that, if correct,
-
Over 80-90% of the last 500 million years, the span of time we can oversee, and which somewhat coincides with the emergence and development of complex life on this formerly (and still mostly) dead planet, the level of atmospheric carbon dioxide has had no coincidence, let alone correlation, with any meaningful trend in the global average surface temperature.
-
The average global temperature levels out (or is capped) at around 22 - 25°C (which would be around 10°C higher than today), completely independent of atmospheric CO2 levels, which range between near zero, or 180, and 7000 ppm within the above mentioned time frame.
-
The only two periods of, combined, around 10-20% of the last 500 million years, in which the level of atmospheric carbon dioxide did coincide, perhaps even correlate, with a meaningful trend in world average surface temperature, were both periods of extremely low global temperature, coinciding with equally extremely low measurements of atmospheric carbon dioxide levels.
-
These two globally extremely cold periods, also being the times when atmospheric carbon dioxide levels and the average global temperature coincided at all, were the Carboniferous Period of around 300 million years ago - and today.
[Note that the Carboniferous Period was a time of great abundance of land-bound life, at least in mass. Please note also that the measurement of the Earth’s surface temperature here is in "global average", but will later change to "polar average"; and that the measurement of the levels of atmospheric carbon dioxide is in percentage or ppm; the latter makes no statement on the amount of CO2 in a global atmosphere of equally unknown volume; this may become important.]
First conclusions
If the depictions above are correct in their statements, then we, for whatever reason, and in the past few million years, have entered a phase of extreme planetary cooling, by now coinciding with very low levels of atmospheric carbon dioxide.
This has happened once before, and indeed, the fall in atmospheric carbon dioxide levels roughly seems to precede the drop in temperature.
But even if we discard the graphs above as inaccurate and speculative, we can look up whatever resolutions we can find of the recent coincidence of these two parameters, i. e. going from the last 500 million years ago (above) to 50, 5, and 1 million years, then down to 500, 50, and 10 thousand years to the present, and see if these depictions are consistent with one another.
[Beware, once again, that the measurement of temperature at one point changes from "absolute, global average" to "relative, polar average".]
Skipping directly to the higher resolution of the recent past, one astonishing find is that, as both the planet's average surface temperature, and the level of atmospheric carbon dioxide move towards a second period of both planetary extremely low superficial temperatures, and equally extremely low atmospheric levels of CO2, around 5-10 million years ago, both parameters begin to oscillate while falling, and this with a fixed frequency, but rising amplitude; this gives rise to the speculation that something has locked.
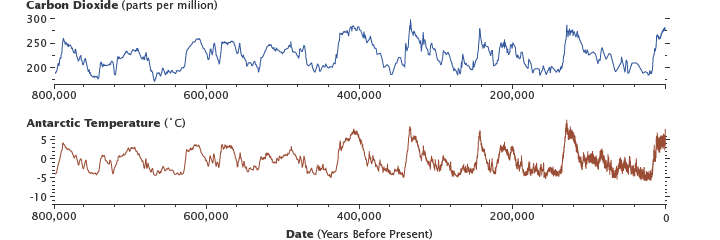
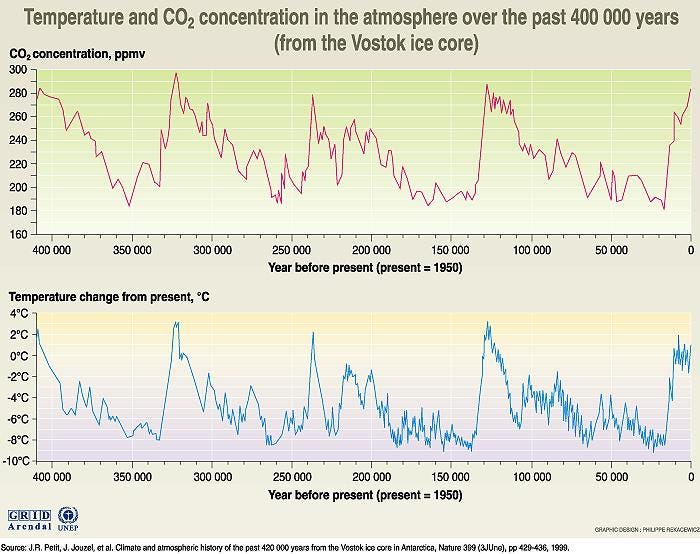
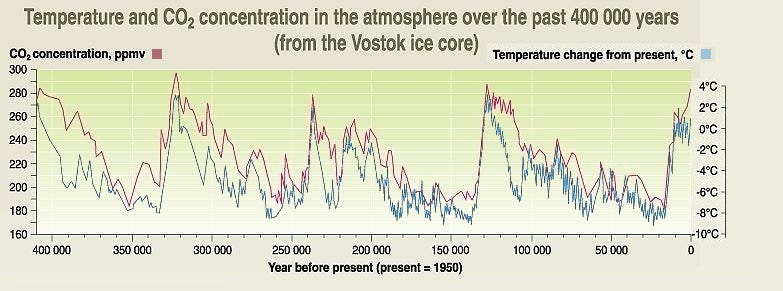
We see that, roughly during the last one million years, this oscillation - now with a fixed, but reversed sawtooth ratio of 10,000 to 90,000 years, in a frequency of around 100,000 years - has also reached a fixed amplitude between +3 and -9 degrees Celsius of average polar temperature relative to today, and between levels of atmospheric carbon dioxide of 180 and 290 ppm (or 0.018 and 0.029%) absolute.
In fact, the Vostok ice core data, which shows a tight correlation between the oscillation of the Earth's average polar surface temperature and its level of atmospheric carbon dioxide during the last 800,000 years,
when combined as overlay:
or taking the 400,000 years resolution,
when combined as overlay:
show that
-
For roughly the last one million years, there has been a tight correlation between atmospheric carbon dioxide levels and mean polar temperatures (though it is yet unclear what is driving what), in which
-
-9 degrees Celsius of average polar temperature, relative to today, corresponds to a level of 180 ppm of atmospheric carbon dioxide, and
-
+3 degrees Celsius of average polar temperature, relative to today, corresponds to a level of 290 ppm of atmospheric carbon dioxide.
Conclusions up to now
-
We seem to be living in a planetary phase of extremely low average global temperatures, corresponding to a depletion of atmospheric CO2, which seem to give rise to surprisingly regular ice ages or glacials every 100,000 years in the last million years at least, of which we at the moment are inhabiting the very peak of a current warm phase or interglacial within that prolonged cold planetary age.
-
For the last million years, short interglacial periods, or sharp inclines of both polar temperature and atmospheric CO2 of around 10,000 years, alternate with long glacial periods, or slow declines of both polar temperature and atmospheric CO2 of around 90,000 years.
-
On closer inspection, we are now not only historically at the peak of the current interglacial warm period within the current glacial fluctuation of this planetary cold age; we have also been there for the last 10,000 years at a stable polar temperature, while the level of CO2 has been rising true to expectations - and this before being enhanced through human industrialization.
-
Given the level of atmospheric carbon dioxide having reached its natural peak of 290 ppm (and recently even surpassing that level) during the last 10,000 years, we should have arrived at the corresponding historic peak temperatures within that time, i. e. around +3°C higher than today, at least in the Antarctic; but we did not.
-
Thus, we are already 20,000 years into the current interglacial, which is highly unusual; the expected peak polar temperature of +3 degrees Celsius has been missed and / or delayed for the last 10,000 years.
[Note also that the peak global average temperature during the last 500 million years is given at no more than +10 degrees Celsius.]
We should at this period in time already be catching naturally falling levels of CO2 and falling polar temperature on the long way down into the next ice age:
If not:
Why aren’t we? ->


Comments
Post a Comment