Page I II III IV V
For a different layout, you can
go to my old _
page or to my
substack
Data basis for flash or morphing experiments

Well, it may not be that easy, as the data is only available here to about 50%.
The age per kilometer of spread - out ocean floor and continental crust is relatively well known, the age of the same, buried under mountains, only as a whole.
To what extent continents and ocean floors were deformed by subduction and mountain building, can only be estimated.
My idea
is to take, for instance, the picture
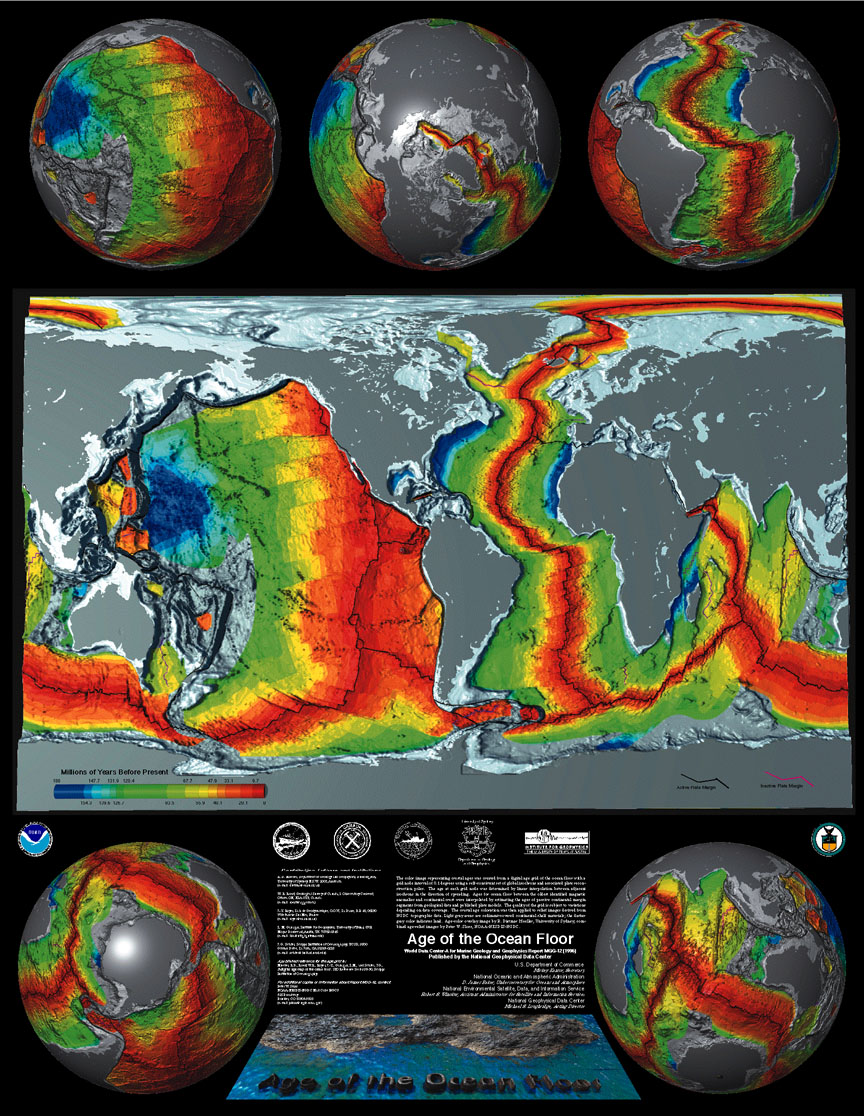
http://www.ngdc.noaa.gov/mgg/image/crustageposter.jpg
and reduce the ocean floor in steps according to its age, as depicted by the colours.
This will not work unless one has continental crust to expand accordingly. To illustrate the last 200 - 250 million years at issue here, one could superimpose the map of the alpine mountain ranges on top of the mentioned picture.
For instance, one could take the first frame of the animated GIF
and resize it to fit.
Or take one of the slides for that purpose.
First results:
 For a start, I have taken yet another map and superimposed it upon the above mentioned
crustageposter.jpg here:
For a start, I have taken yet another map and superimposed it upon the above mentioned
crustageposter.jpg here:

 And have
added a bit of guesswork
here ( assuming that the seafloor spreading was more or less uniform over time; this need not have been the case ). With a bit of work and some color reduction, this one could probably be used as a basis for flash or morphing experiments.
And have
added a bit of guesswork
here ( assuming that the seafloor spreading was more or less uniform over time; this need not have been the case ). With a bit of work and some color reduction, this one could probably be used as a basis for flash or morphing experiments.
 |
| crustage4b.jpg |
 To make it a bit easier, I have put both manipulated .JPGs
into this archive
here:
To make it a bit easier, I have put both manipulated .JPGs
into this archive
here:
Here, the data basis leaves us
Today, it cannot be said with certainty how old the consecutive folded mountain ranges are down below in accordance with the ocean floor. But I would say a successive unfolding, as a straightening of
crumpled table cloth, would be in order.
But just how far?
Until the Alps, the Himalayans, and the Andes are completely straightened out and flat.
Again, how far would this be?
This is a matter of common sense, speculation and whatever the machine will make of it. And, perhaps, of an erosion relation of 10:1.
And finally we will have to tear them apart, for where they are now, there was once ocean floor; in fact they consist of it for the most part.
- The black structure in the GREEN part of the Pacific running from Kamchatka in Asia in the northwest to the Hawaiian Isles in the southeast could be taken as a mid-ocean ridges for that part of the ocean floor at the time of its expanditure.
- For added effect, these ridges [ now in the RED part of the ocean floors ] can be shown flaming red while wandering over, or rather, under completely dark-blue oceans.
- This is, indeed, the interesting part which will, I hope, bring out the most astounding results. So, it may be simple, but not easy.
- But I would find it grand if you would still give it a try. The result should shadow anything tried up to now.
Model: The breakup of Pangaea
The breakup of the once "supercontinent" Pangaea in light of a supposed
sinusoidal mantle flow below the Earth's crust:

Map 1: In Red: The supposed sinusoidal mantle flow below the Earth's crust
The breakup of Pangaea...
into the (proto-) continents existing today - albeit modified by continental deformation, the lifting of ocean floors (partly to form the highest peaks) etc., beginning some 200 million years ago. |
| [ Model 1, left: Future Eurasia lies east of future North America ] |
 |
| [ Model 2, right: Future Eurasia lies west of future North America ] |
... over the undercurrent southeastern mantle flow:


Note:
Although
Model 2
was used in this depiction,
Model 1
is far more consistent with both objective fact
and
the
undercurrent equatorial magma sinus flow
hypothesis as proposed here.
In fact, it is still not nearly consistent enough; even in Model 1 future Eurasia needs to be placed much further to the south. The Atlantic ocean is a real rift, opening not only between South America and Africa, but between Canada and Scandinavia as well.
Furthermore, Africa needs Eurasia as a counterpart to push future Europe Tethys floor into, folding up the Alps, as India does, to form the Himalayas.
Not taken into account at all is the amount of continental deformation and real crust subduction; the continents, then, did not have the shape of the continents now - where now there are mountains, millions of square miles of former continental crust lie hidden below, and above, ground level; Proto-India, for instance, would have had to have a future Tibet bulge, not a dent, to its (then) northeast.
All things taken into account, a more fact-consistent Pangaea Model would look a bit different, a bit more compact and elongated differently, and the
sinus flow magma undercurrent
would be more compact as well to stay in proportion; and, this being a map, not a globe, the northern and southern regions would have to be disproportionately spread as in
Map 1.
This schematic depiction serves only to illustrate the principle.

http://www.scotese.com/pangeanim.htm
and look here for instructions on what to do with it.
This standard animation, exploding Pangaea in all directions from Africa, probably is due to our Euro- and therefore, Africa-centered view onto the globe.
It accounts for sea floor spreading in the Atlantic and Indian oceans, but not in the Pacific.
I came across Dr. Scotese's animated maps & globes long after I worked up mine, which was around 1996. And I wouldn't mind, since his animations (which, along with his expertise, are far superior to mine) put out roughly the same results, which I view as an honor.
But there is one difference: I go a step further, that I do not know if Dr. Scotese takes, since I have not read his books, and his animations (the ones that I know of) always center on the map he is projecting, thus making the continents
move in all directions.
My own conclusion, however, is that the continents (all of them) are moving generally EAST (some just faster than others), ever since the beginning, driven by the Earth's core rotating faster than its surface by about 1 extra revolution every 900 years, a fact that seems to have been proven by now
.I had calculated (not measured) 1 extra revolution in every 1,000 years, which is pretty close; this would be making its influence felt as an equatorial surface drag of roughly 200 meters per extra core revolution, displacing trillions of tons of rock by 200 meters every millennium. Some put it even higher than that.
For that reason, I would extrapolate the future geography a little different than Dr. Scotese does.
Furthermore, there seems to an idea that really disruptive earthquakes sequence events or 'storms' take place in somewhat regular intervals of around 400 years, with lulls in between.
If this were so, it could perhaps be connected to the somewhat 3-fold irregularities of the Earth's core, which would then pass under any given location closer to the equator about once every 300-350 years... but this is just speculating.
More:
Magma flow: time and distance estimate
Undulations of the Earth's core
on Tracing the Continental Drift
Comments
Post a Comment